Atly: using AI to match place data with personal taste
Atly had two assets it wasn't using together: deep, community-built data about places, and a growing understanding of what each user likes. The early product leaned on generic mapping conventions and didn't connect the two. Bringing them together, with AI matching place data to personal preferences and search intent, turned a pre-revenue social mapping app into a six-figure ARR business. The proof came from a single gluten-free map: asked to reach five-figure ARR, it reached six figures and has kept growing since.
A rich community, a thin business
Atly (formerly Steps) launched publicly in 2023 with $18M in funding. Around 120,000 members curated 6,500+ map communities about the places they love. The knowledge in those maps was deep, but the product around it borrowed generic mapping conventions that hid it. And the business was pre-revenue.
The problem
Every mapping app rates places, and most show you all of them. A 4.5-star pizzeria is the right answer for one search and the wrong one for another, so a long list of well-rated options still leaves the hard part, deciding where to go, to the user. Atly needed an experience and a business model built on what people mean when they search and who they are, and proof that people would pay for it.
Constraints
A live community. Redesigns could not break the workflows of the members and map creators who built Atly's value. A lean team. Every exploration had to justify its engineering cost. A revenue mandate. Monetization had to be proven through product and data, not a marketing budget. Data economics. Trustworthy, granular recommendations came from manual curation, which does not scale. The design problem and the AI problem turned out to be the same problem.
Outcome
A match score that combines place data, user preferences and search intent at the core of the product. A single-surface interface. A proof-of-concept map that beat its revenue target more than tenfold and became the business. A paywall and onboarding journey that more than doubled conversion.
The insight
People don't search for a place. They search with an intent: “romantic pizzeria for a first date,” “a café I can work from.” And the same search means different things to different people. Star ratings answer a question nobody asked.
Atly already held what was needed to answer the real one. The place data was granular enough to describe what a place is good for, and user preferences could describe who is asking. Matching the two, rather than ranking places for everyone, became the product's central idea. Its job became narrowing, not listing: show only the places that fit, make the choice easier, and reduce the chance of a disappointing night out. That position became the app's promise: Know where to go. Your kind of places.
Research as a continuous input
Decisions ran on a steady mix of product analytics, user interviews, app-store reviews and A/B tests. Failed experiments counted as research: two of the most useful findings came from features that shipped, were measured, and were removed.
Alternatives tested and dropped
There was pressure to borrow engagement patterns from social apps. The concern going in was that they would not suit a utility product: the content wasn't compelling enough to browse for its own sake, and the interaction cost was too high for someone trying to decide where to eat. Rather than argue it in the abstract, both ideas went out as quick MVPs.
Swipe-style place cardsTested · removed
Choosing where to go is comparative and spatial. People weigh options against each other and against distance, not one isolated yes or no at a time.
A social feedTested · removed
It invited scrolling, but Atly users arrive with a decision to make, not time to fill.
Both were removed. The results settled the direction: the advantage lay in understanding what users were looking for and cutting everything else away.
The trade-offs that shipped
Score the search, not the placeKey decision · shipped
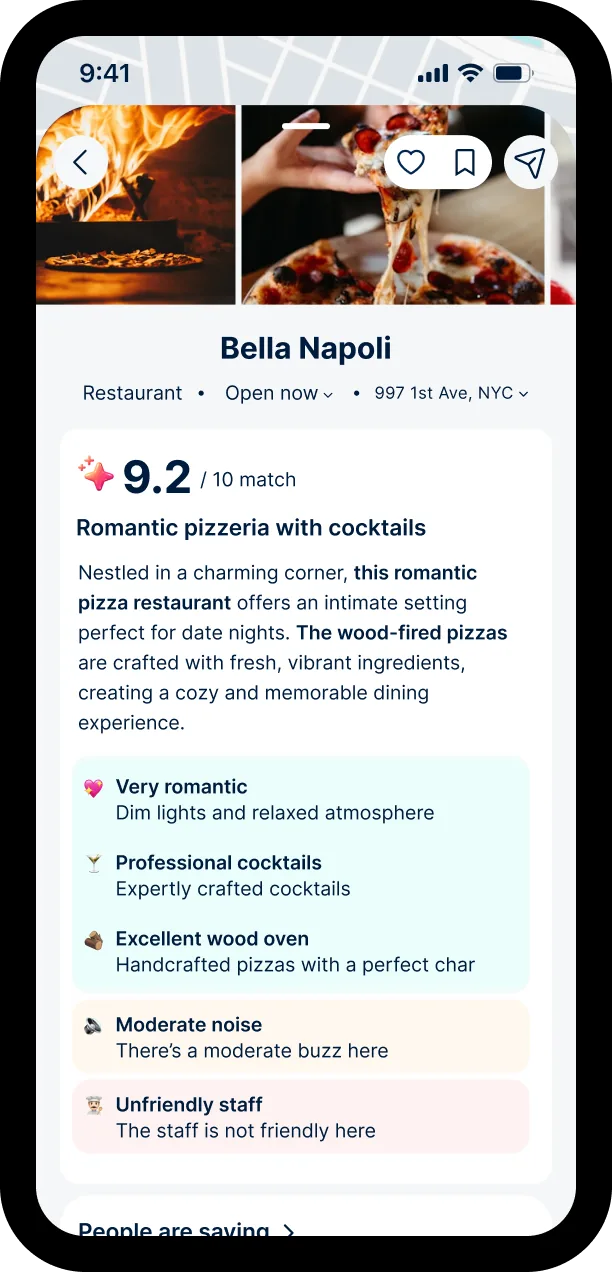
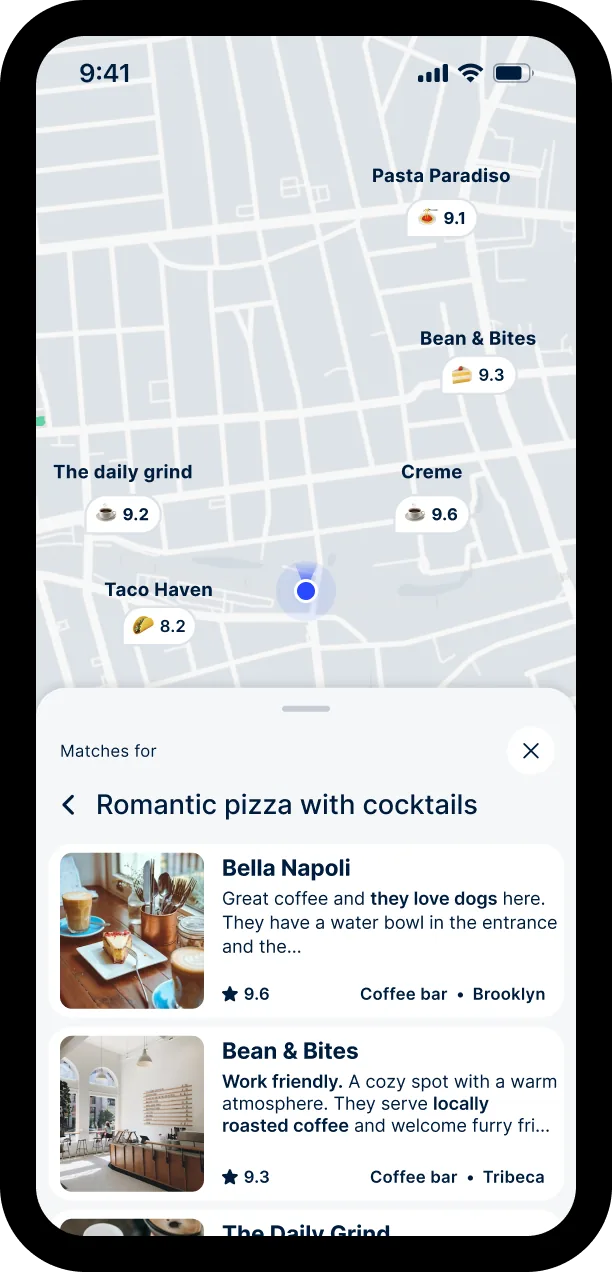
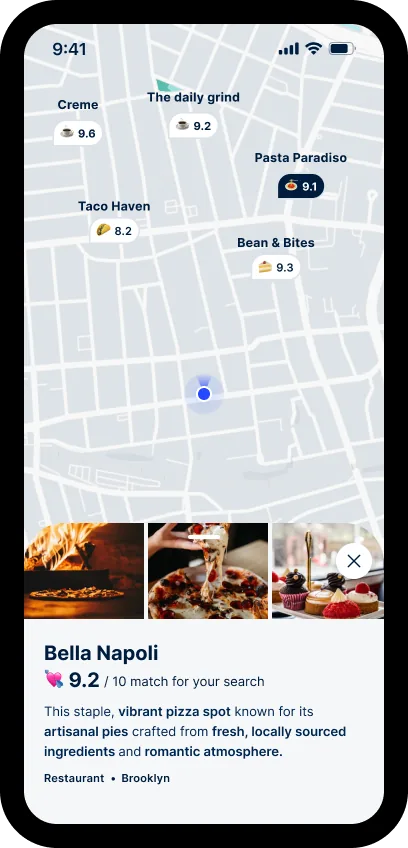
Atly analyzes reviews across platforms and computes a match score against the user's intent. The same pizzeria scores 9.2 for “romantic first date” and differently for “quick work lunch.” The cost was a heavy data pipeline instead of a simple ratings field, and a number that looks familiar but means something new.
The expected risk wasn't mistrust but misreading: people are trained to see a score as a property of the place. The design treated that as the main problem to solve, with three reinforcing cues. The score always repeats the user's own words: “9.5/10 for romantic pizzeria.” A loading state frames the moment: “Calculating scores for your search.” Labels read “Match for [search term],” never a bare number. Evidence sits directly under the score, negatives included (“moderate noise,” “unfriendly staff”). With all of this in place, users read the score as intended, and trust followed, though not universally.
Personalization as the matching engineKey decision · shipped
Intent alone describes one search. Leaning heavily into personalization connected each user's taste profile to the place data, so results and curated content fit the person as well as the query. This is the other half of the match: the place data says what a place offers, preferences say what this user values.
One surface instead of deep menusKey decision · shipped
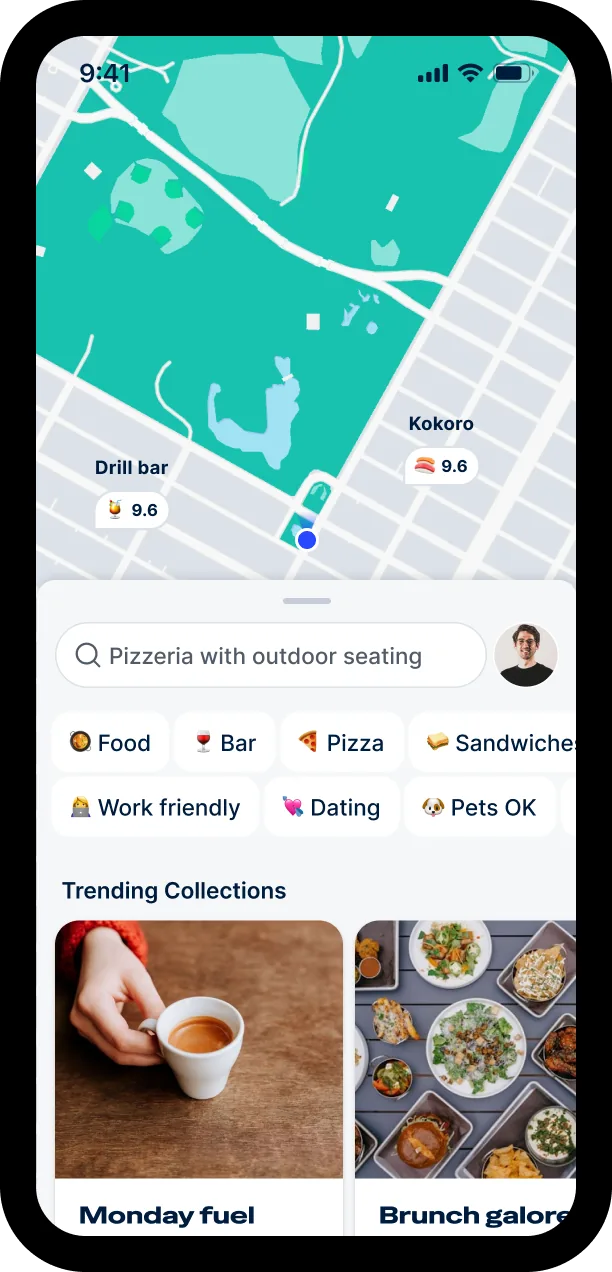
For a younger, mobile-first audience, the interface moved away from nested menus toward a single continuous space: natural-language search, the map and sliding result sheets together. Lighter to use, without losing the depth of a serious mapping tool.
The role started as Design Lead, directing two designers alongside the founders, product management and engineering. As Atly restructured into a small, AI-native team, it became a team of one, covering the full width of the product: strategy and roadmap with the founders, prioritization and experiment design, the research behind both, and the shipped screens. Research, flows, UI, prototyping and QA ran through one person, with engineers as daily partners.
Design led these decisions end to end
- The match score and the system of cues that made it readable.
- Personalization as the core of matching users to places.
- Removing the card browser and social feed after making the case against them and testing them.
- The single-surface layout for search, map and results.
- The gluten-free map, from the research with celiac diners to its design and feature set.
- The paywall and onboarding, including the experimentation behind them.
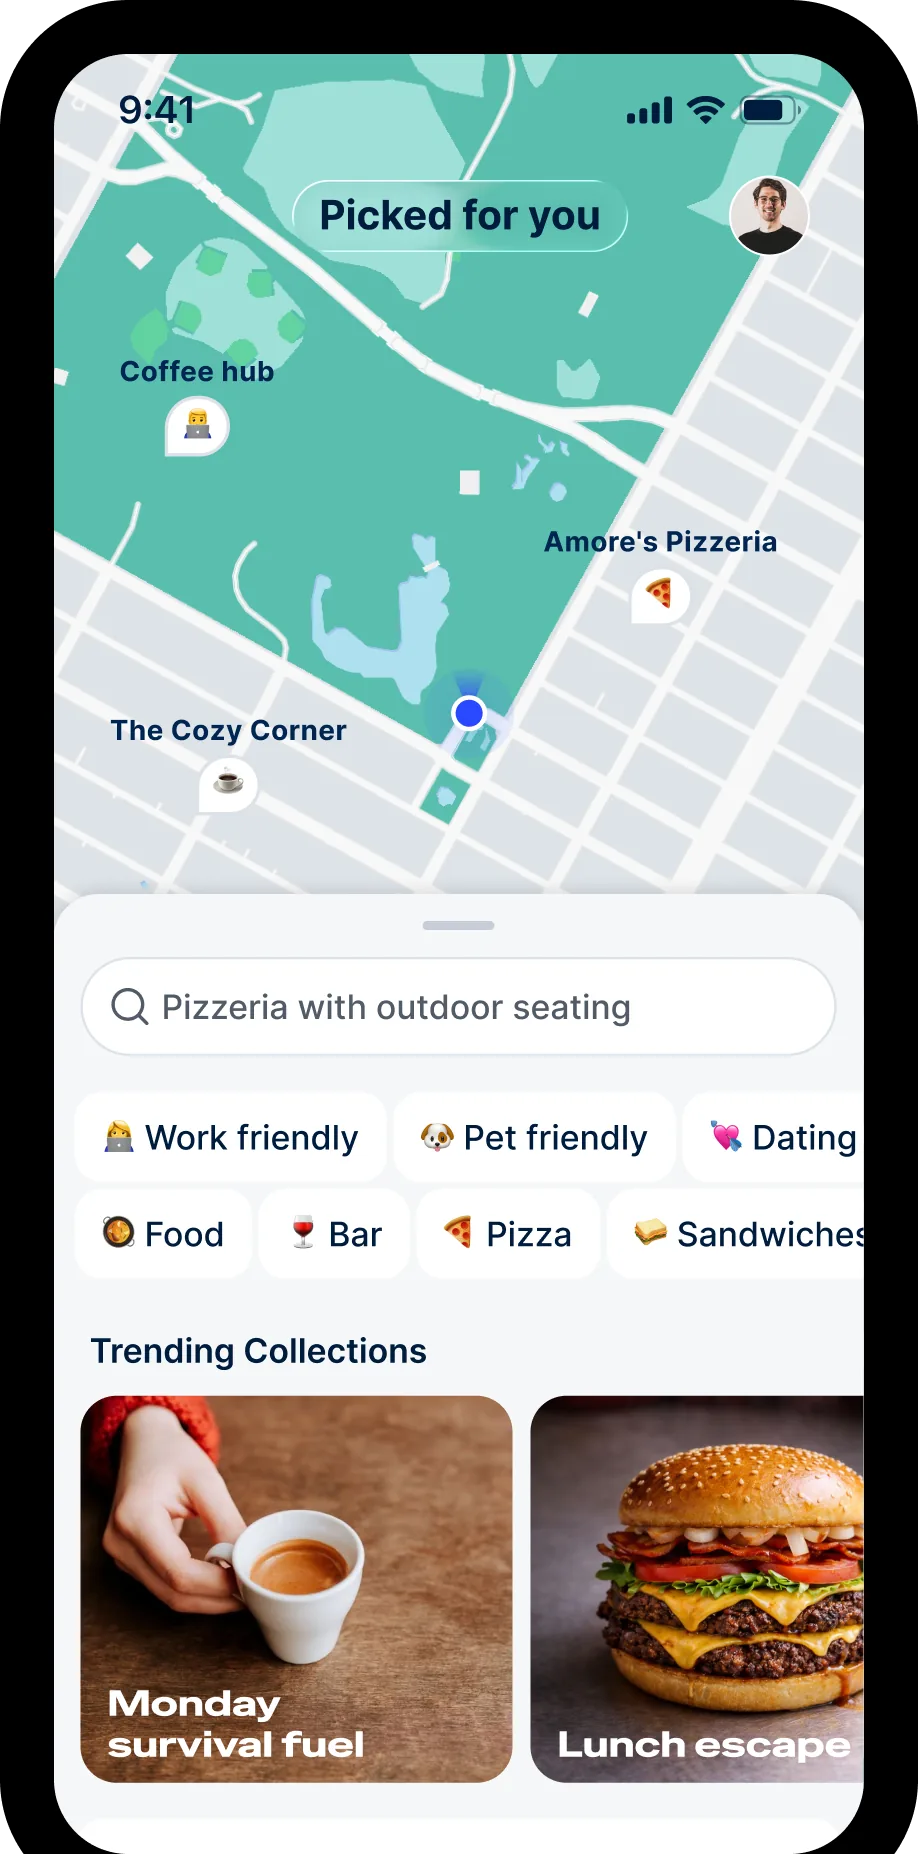
One scroll, three jobs, split by what the user is doing in that moment.
-
1
Discovery
The top half shows content matched to the user's preferences.
-
2
Intent
The middle holds direct search and filters, capturing what the user is looking for right now.
-
3
Curated content
The rest of the scroll offers lists matched to the user's taste profile.
Proving the business with one map
Investors asked for a proof of concept: take a single map and show it could reach five-figure ARR. Stakeholders chose gluten-free, a community where a wrong recommendation has real consequences and the value of a precise match is easy to feel.
The design started with thorough user research, including conversations with celiac diners. That research shaped a map built at full depth: a safety classification system developed with dieticians and nutritionists, 270,000+ curated locations, and a dedicated data team.
It launched in 2024 as Atly's first subscription map. Against a five-figure target, it reached six-figure ARR as a proof of concept and has kept growing, the revenue that took Atly from pre-revenue to a commercial business. It showed that precise matching between place data and personal needs is something people will pay for, and it validated subscriptions as the model.
Making the paywall work
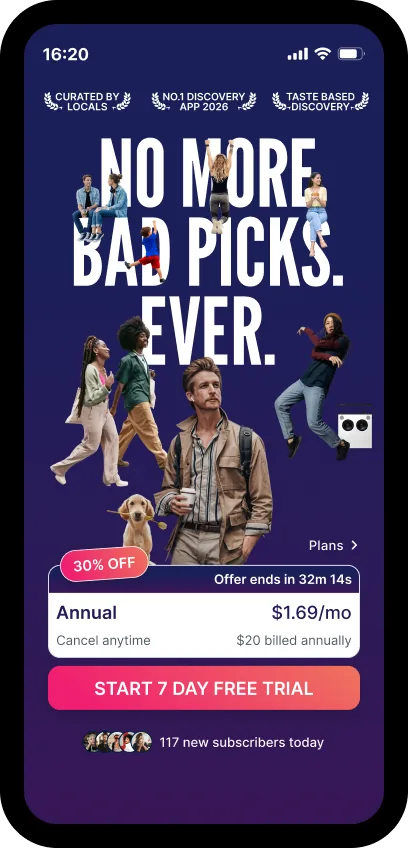
Ten paywall variations were A/B tested. The winner increased conversion by 124%.
The next gain came from the journey around it. Ad campaigns already targeted interests such as “Work friendly” or “Night out,” but everyone landed in the same generic flow. Matching the onboarding and paywall to the theme of the campaign that brought each user in kept the promise consistent from ad to purchase, and lifted conversion by a further 53%.
What changed
Atly went from pre-revenue to six-figure ARR, driven by a single map that beat its five-figure target more than tenfold. Subscriptions were proven as the business model. And the same logic now drives the AI roadmap: reaching that level of granularity through large-scale analysis of place data, without manual curation, for every category of search.
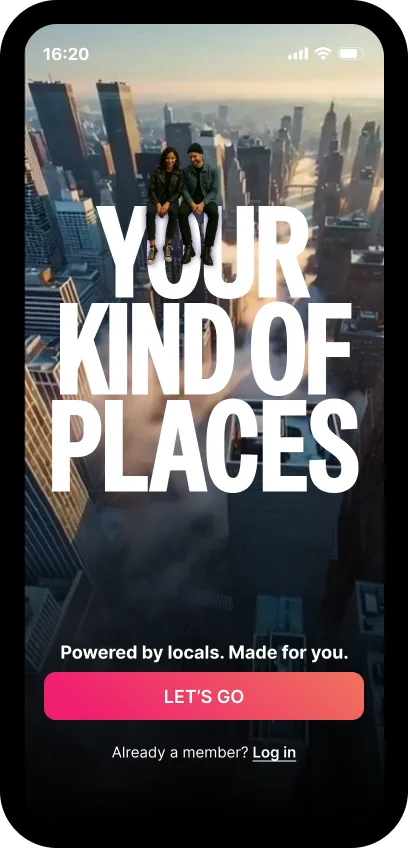
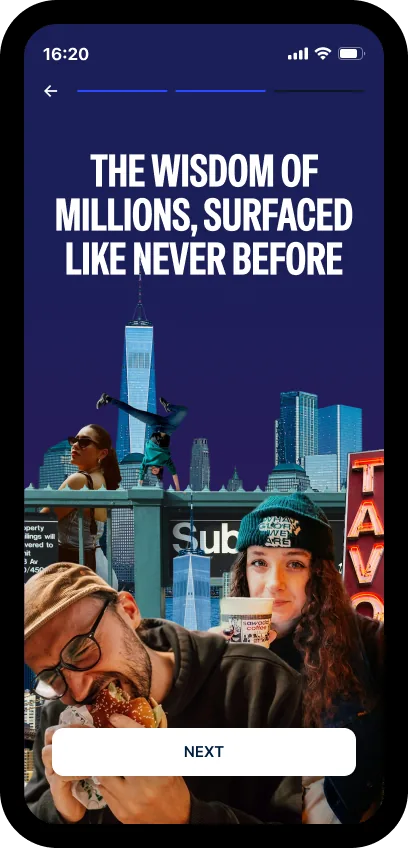
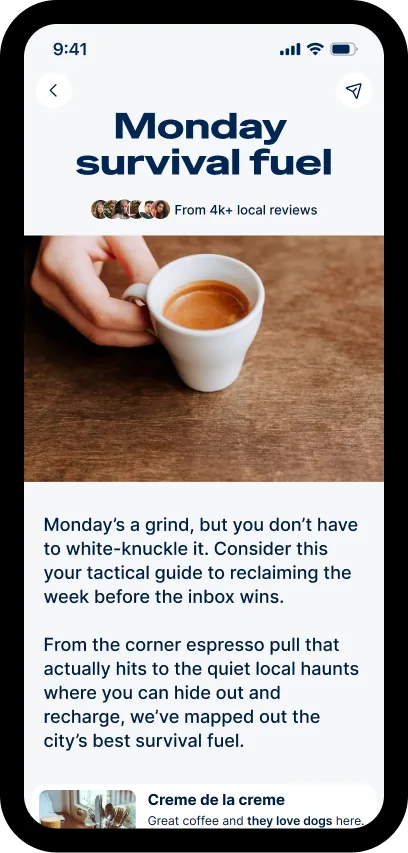
The screens below follow that sequence. Onboarding sets the positioning: your kind of places, powered by locals. The place page shows the core mechanic, scoring a pizzeria 9.2 out of 10 for “romantic pizzeria with cocktails for a first date” and laying out the evidence underneath. On the map, every pin carries a match score for the current search. Editorial collections condense thousands of local reviews into guides. The subscription flow closes the sequence with the paywall that made the product commercial.

Sources: TechCrunch on Atly's $18M launch (2023) · Gluten-Free Eats launch (2024). Conversion figures from internal A/B tests.
Disagree, then test
The social patterns were a direction the design view argued against. When leadership wanted to see them tested, the right move was to make that test cheap and fast rather than block it. Quick MVPs turned a disagreement into evidence, and the evidence gave the team a shared conviction instead of a compromise.
Anticipate the misunderstanding
The match score was designed around the problem users were most likely to have with it. Repeating the search, framing the calculation and labelling every match were cheap to build and removed the biggest risk to the product's core idea.
Carry the promise through
A paywall is judged by conversion, but the second lift came from outside it: aligning ads, onboarding and paywall around the same user intent. The same principle as the match score, applied to the business.
The pattern worth keeping
The gluten-free map set a repeatable approach: start with the people who need the match most, prove the value at full depth by hand, then teach the system to scale it. AI didn't change what a good product decision looks like. It changed what is affordable to build.